
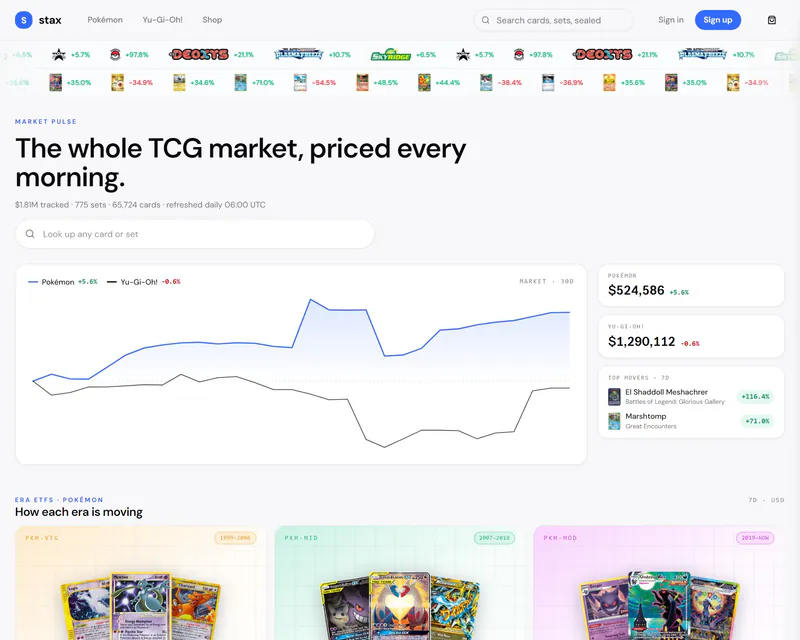
Your data. A clearer view.
Bring relevant information into dashboards your team can use. We connect the sources, agree on definitions and build the filters, reports and exports you need.
Deliverables
- Query layer / API
- Interactive dashboard
- Drill-down & filters
- Export & sharing
- Scheduled reports
Outcomes
- Faster insight loops
- Self-serve analytics
- One source of truth
Typical stack
From first call to production launch.
Discover
30-min call + a written take. We map risks, assumptions, and the real scope behind your ask.
Design
Architecture, schemas, and the smallest thing we can ship to learn. Sign-off before code.
Build
In your Slack daily. Weekly demos against staging. PRs with notes, not status emails.
Ship
Production launch with a runbook your team can operate. Optional retainer for ongoing care.
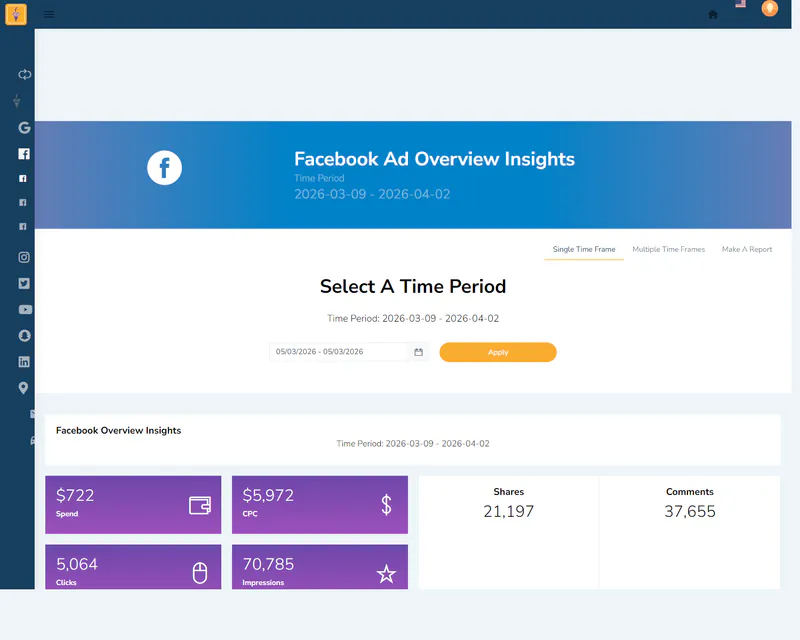
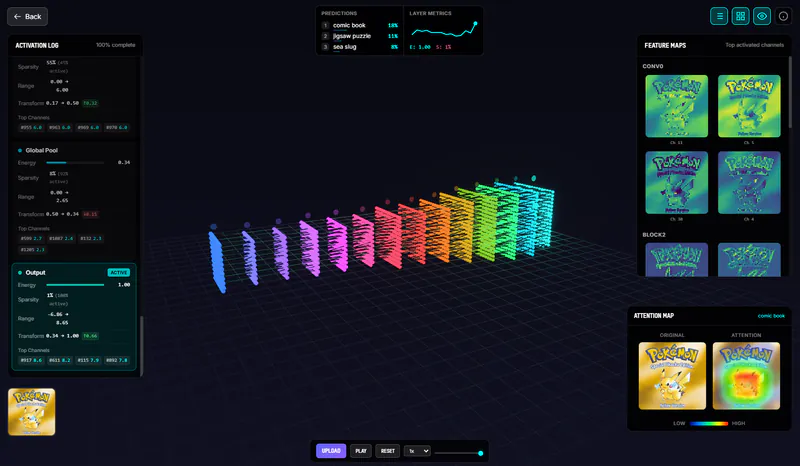
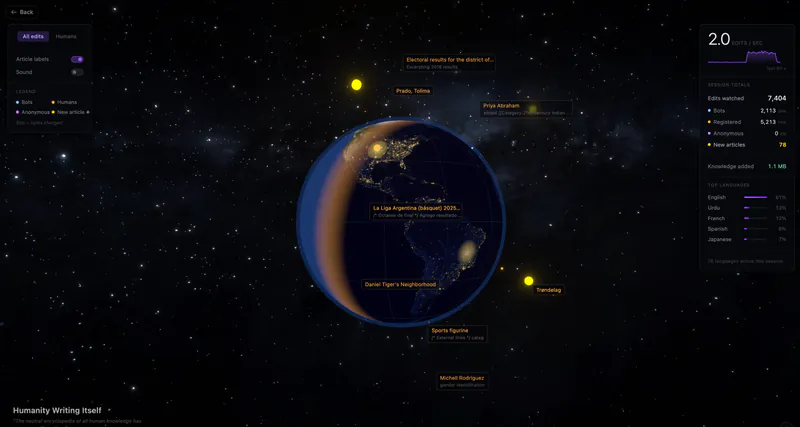
Need design, campaigns or customer follow-up alongside this work? Explore our full-service approach.

Software integrations
Connections between payments, CRM, accounting, scheduling and other business systems, with clear error handling.

Live data & collaboration
Live updates, chat, shared editing and activity views for products where waiting for a refresh interrupts the task.

AI features for your software
AI features for document processing, classification, search and assistance, connected to your software and measured against real tasks.

What do you need to see clearly?
Tell us which decisions your team needs to make and where the information lives. We’ll help shape a useful view.